

Albuquerque Housing Market Report: April 2026 — Median Price Climbs to $342,000 as Inventory Tightens
Albuquerque Housing Market April 2026: Metro Overview and Headline Numbers
The Albuquerque residential market entered spring 2026 with the kind of quiet momentum that doesn't make headlines but absolutely shapes outcomes for anyone buying or selling along the Rio Grande corridor. The metro median home price closed March at $342,000, up 3.8% year-over-year and representing the sixth consecutive monthly gain in the trailing six-month trend. That number is not a spike driven by a handful of luxury closings — it reflects broad-based demand compression in the $280,000-to-$420,000 range, where the overwhelming majority of Albuquerque transactions happen.
To understand why prices are grinding higher without the volatility that characterized 2021 and 2022, you have to look at the supply side. Active listings stood at 1,240 at the end of March, down roughly 6% from February and down meaningfully from the 1,400-unit count last October. New listings are coming to market — 890 new listings hit the MLS in March, the highest monthly intake since last summer — but 680 closed sales absorbed nearly all of that fresh supply before it could accumulate. The pipeline fills and empties almost simultaneously, which is what a 1.8 months of inventory figure actually looks like in practice.
This is not a frenzied market. It is a disciplined, supply-constrained market where well-priced homes move fast and overpriced homes sit. That distinction matters enormously for how buyers and sellers should position themselves this spring.
Albuquerque Housing Inventory: Supply Tightening Into Peak Season
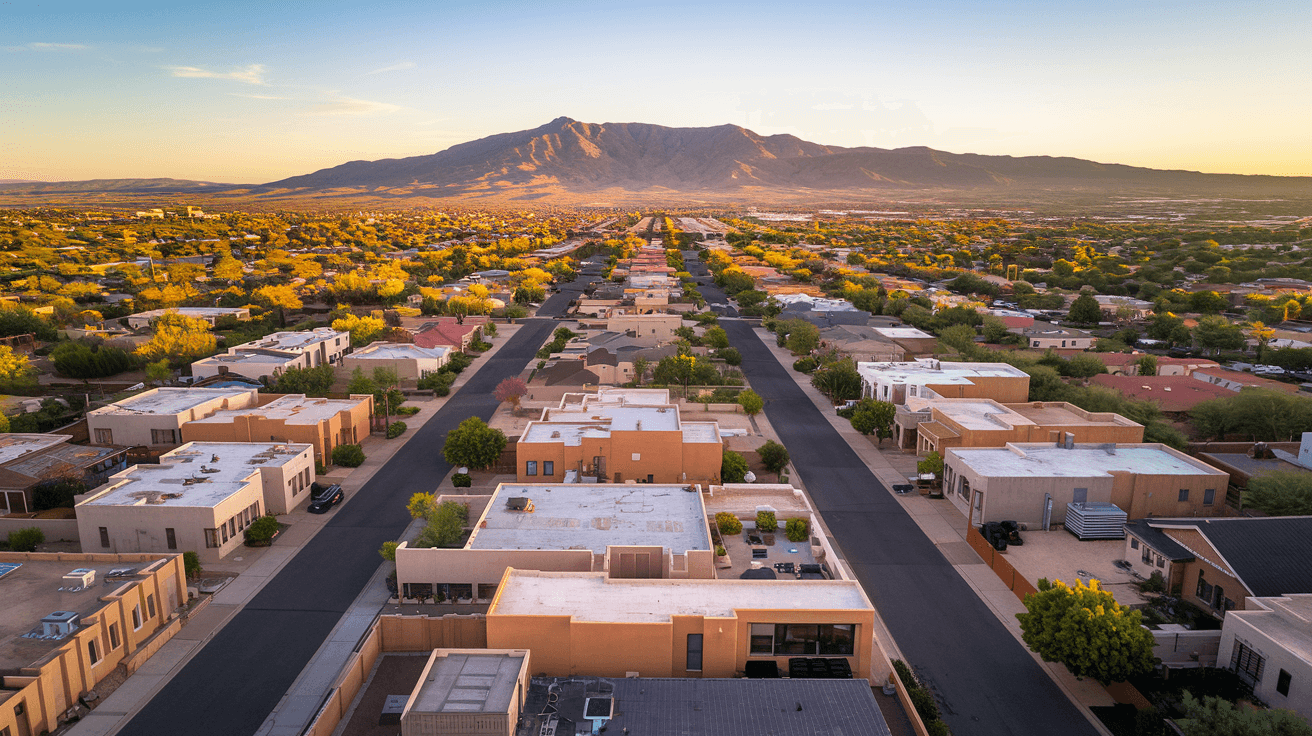
The inventory story in March 2026 is one of seasonal acceleration meeting structural scarcity. Albuquerque has never been a high-inventory market by national standards — the city's geographic constraints (the Sandia Mountains to the east, the bosque and river corridor to the west, tribal lands and military installations defining the broader metro boundary) limit how far the housing stock can expand. But the current 1.8-month supply is particularly tight because it is arriving at the front edge of the spring buying season, when demand historically peaks between April and June.
New listings in March totaled 890, a 7.2% increase over February's 830 and the strongest new-listing month since August 2025. That sounds encouraging for buyers, but context is everything: closed sales of 680 consumed the majority of that new supply, and homes that entered the market in the first two weeks of March were largely under contract before the month ended.
Compared to March 2025, active inventory is down approximately 11%, while closed sales are up roughly 6%. That year-over-year compression is the clearest signal that the market is tightening, not loosening, as we head into the traditionally busy April-through-June window. Sellers who were waiting for spring to list are making the right call on timing. Buyers who were waiting for inventory to improve may be waiting for a condition that does not materialize this cycle.
“"At 1.8 months of supply, Albuquerque has less than half the inventory that economists consider a balanced market. Every week of delay costs a buyer negotiating leverage they will not recover."
Albuquerque Home Prices by Tier: Where Competition Is Hottest
The metro-wide median of $342,000 tells one story. The price-tier breakdown tells a more nuanced one.
$200,000 to $300,000
This tier is functionally sold on arrival. Homes priced here — primarily in the South Valley, parts of the International District along Central Avenue east of Louisiana, and older stock in the West Side near Unser Boulevard — are receiving multiple offers within days and frequently closing above asking price. The list-to-sale ratio in this segment is running above the metro average of 98.2%, with some properties closing at 101% to 103% of list. First-time buyers and investors are competing for the same pool of homes, which is compressing availability and pushing some first-time buyers up into the $300,000-$350,000 range.
$300,000 to $400,000
This is the market's engine room. The highest transaction volume in the metro occurs here, concentrated in the Northeast Heights grid between Menaul and Montgomery, Rio Rancho's Cabezon and Lomas Encantadas subdivisions, and the Taylor Ranch area near Paseo del Norte. Average days on market in this tier runs 14 to 19 days, and homes that are staged, priced at current comps, and photographed professionally are going under contract on the first weekend. Price per square foot in this tier has risen to approximately $185 to $205, up from $175 to $195 a year ago.
$400,000 to $500,000
The mid-tier is where the market starts to breathe. Homes in this range — think updated ranches in the Four Hills area, newer construction in Nob Hill's eastern edges, or well-maintained properties near Tramway and Academy — are still moving in under 25 days on average, but buyers have time to conduct proper due diligence and occasionally negotiate minor concessions on repairs. This tier has seen the most significant quality improvement in inventory, as sellers who bought in 2018-2020 at lower price points have invested in renovations and are now listing upgraded homes.
$500,000 and Above
The luxury and semi-luxury segment above $500,000 is where patience becomes a viable buyer strategy. Corrales and High Desert dominate this tier, along with custom homes in the North Valley and a handful of properties near Elena Gallegos Open Space. Days on market stretch to 28-35 days, and list-to-sale ratios dip closer to 96% to 97%. This is still a seller's market at the top, but it is a seller's market where buyers have enough breathing room to negotiate.
Albuquerque Days on Market: What the 22-Day Average Means for Offer Strategy
The metro-wide average of 22 days on market is the number that should most directly shape how buyers approach offers in April and May. Twenty-two days is a mean, which means the distribution around it matters. In the $200,000-to-$350,000 range, the effective decision window is often 72 to 96 hours from list date. In the $500,000-plus tier, buyers may have two to three weeks.
For buyers working with an agent who has MLS alert systems set up, the practical implication is this: if you see a home in the Northeast Heights or Rio Rancho that fits your criteria and is priced at or below current comps, you should be prepared to tour within 24 hours and submit within 48. Waiting for an open house the following weekend is a viable strategy only if you are comfortable watching that home go under contract before you arrive.
The 22-day DOM figure is also down from 26 days in October 2025, confirming the directional trend. As spring demand builds through April and May, expect that number to compress further, potentially reaching the high teens by May. The last time Albuquerque averaged sub-20 days on market was the spring of 2022, and while this market is not that market, the directional pressure is similar.
Albuquerque Neighborhood Breakdown: March 2026 Data by Area
Neighborhood-level data is where metro averages give way to the granular reality that actually governs individual transactions. Here is how the major Albuquerque submarkets performed in March 2026.
Northeast Heights
The Heights remains Albuquerque's most liquid submarket. Median price: $324,000. Average DOM: 14 days. Year-over-year price change: +4.2%. The grid of streets between Menaul and Montgomery, from Louisiana east to Tramway, is generating consistent transaction volume. Homes near Eldorado High School and Monte Vista Elementary corridors are particularly active. The 14-day DOM is the tightest in the metro and reflects a buyer pool that includes Kirtland AFB personnel, Sandia Labs employees, and UNM-adjacent professionals who need proximity to both the base and the university corridor.
Nob Hill
The Central Avenue corridor from Girard to Washington, and the residential streets radiating north and south from it, continues to command a premium. Median price: $385,000. Average DOM: 18 days. Year-over-year price change: +3.5%. Nob Hill's walkability score, proximity to the Nob Hill Business District, and the density of renovated bungalows and craftsman homes attract a buyer profile that is less rate-sensitive and more lifestyle-driven. The 18-day DOM reflects a slightly more selective buyer pool, but inventory here is extremely thin — fewer than 30 active listings at any given time in March.
North Valley
The North Valley, bounded roughly by Alameda to the north and Griegos to the south, with the bosque defining its western edge, is Albuquerque's most geographically distinctive submarket. Median price: $420,000. Average DOM: 20 days. Year-over-year price change: +3.2%. Larger lots, agricultural zoning overlays, mature cottonwoods, and proximity to the Rio Grande Nature Center drive demand from buyers seeking a rural aesthetic within city limits. Inventory here is structurally limited — you cannot build your way out of scarcity when the land itself is the asset.
Rio Rancho
Rio Rancho continues to be the metro's most active affordability valve. Median price: $285,000. Average DOM: 16 days. Year-over-year price change: +4.8%. The strongest year-over-year appreciation in the metro reflects ongoing demand from first-time buyers priced out of Albuquerque proper, as well as Intel's continued presence on the west mesa providing a stable employment base. The Cabezon subdivision and the newer construction along Southern Boulevard near the Rust Medical Center campus are the volume leaders. At $285,000 median, Rio Rancho is doing significant work as the entry point for the metro's first-time buyer population.
Corrales
Corrales operates on its own logic. Median price: $575,000. Average DOM: 28 days. Year-over-year price change: +2.1%. The village's one-acre minimum lot sizes, equestrian properties, and acequia-irrigated landscapes create a micro-market with no real comparables elsewhere in the metro. Appreciation is slower here not because demand is weak but because the buyer pool is narrow and deliberate. Corrales buyers are typically not under deadline pressure, and the homes they are buying are genuinely irreplaceable. The 28-day DOM is appropriate for this asset class.
High Desert
High Desert, the master-planned community perched on the west slope of the Sandias above Tramway, is the metro's premier luxury address. Median price: $625,000. Average DOM: 32 days. Year-over-year price change: +1.8%. The slowest appreciation in the metro at this price point reflects the national luxury market's sensitivity to interest rates and equity market conditions, but High Desert's fundamentals — gated access, trail system connectivity to the Sandia foothills, and proximity to Sandia Labs and the Journal Center employment corridor — remain intact. Homes here are priced for a specific buyer, and that buyer is not in a hurry.
Downtown / EDo (East Downtown)
The Downtown and EDo corridor, anchored by the Alvarado Transportation Center and stretching east along Central to the UNM campus, is a market in transition. Median prices in the attached and smaller detached product here run $295,000 to $340,000, with DOM averaging 24 to 28 days. The film industry's ongoing presence at Albuquerque Studios and the continued buildout of the Rail Yards Market district are generating incremental demand, but buyer hesitation around walkability infrastructure gaps keeps this submarket from performing at the level its location would theoretically support.
Taylor Ranch
Taylor Ranch, the established West Side neighborhood north of Paseo del Norte between Coors and Unser, is a reliable mid-tier performer. Median prices run $310,000 to $350,000, DOM averages 17 to 21 days, and year-over-year appreciation is tracking close to the metro average at approximately 3.5% to 4.0%. The neighborhood's school district alignment, proximity to the Paseo del Norte/I-25 interchange, and relatively consistent inventory make it a predictable market for buyers who need certainty over excitement.
What the March 2026 Data Means for Albuquerque Buyers and Sellers

For Buyers
The spring 2026 Albuquerque market rewards preparation and punishes hesitation. At 1.8 months of inventory and a 22-day average DOM, the window between a home appearing on the MLS and that home going under contract is measured in days, not weeks. Buyers who are not pre-approved — not pre-qualified, but fully underwritten and pre-approved — are operating at a structural disadvantage in any multiple-offer situation.
Specific advice for buyers entering the market in April: get your pre-approval letter updated to reflect current rates before you tour a single home. Understand your walk-away number before you make an offer, because you will not have 48 hours of deliberation time in most transactions below $400,000. If you are flexible on neighborhood, Rio Rancho's $285,000 median and 16-day DOM gives you slightly more room to maneuver than the Northeast Heights at 14 days. And if you are targeting the $300,000-to-$400,000 range in the Heights or Taylor Ranch, be prepared to write an offer at or above list price with an escalation clause if your agent recommends it.
“"The buyers who succeed in this market are the ones who have done their homework before they fall in love with a house — not after."
For Sellers
If you are considering listing in April or May 2026, the data is about as favorable as it gets in a non-bubble market. The 98.2% list-to-sale ratio means that a correctly priced home is selling for essentially what you ask. The operative word is correctly. Homes priced at or slightly below current comps are generating multiple offers and closing above list. Homes priced 3% to 5% above current comps are sitting, accruing days on market, and eventually selling at or below what a correct initial price would have achieved.
The single highest-value investment a seller can make right now is professional photography and a realistic pricing conversation with their agent. In a market where buyers are making decisions in 48 to 72 hours based on MLS photos, presentation quality is not cosmetic — it is transactional. Homes in the Northeast Heights and Rio Rancho that are staged, photographed professionally, and priced within 1% of current comps are routinely receiving three to six offers in the first weekend.
Albuquerque Real Estate Outlook: What to Expect in April and May 2026
The seasonal pattern for Albuquerque is well-established: transaction volume peaks in May and June, median prices typically reach their annual high in June or July, and inventory — while improving slightly through April — rarely builds fast enough to meaningfully shift negotiating leverage toward buyers before summer. Based on that pattern and the current data, here is what to expect.
Median price is likely to test $348,000 to $352,000 by May, continuing the steady appreciation trajectory visible in the six-month trend. A significant rate move — either direction — could alter that, but absent a Federal Reserve surprise, the fundamental supply-demand math supports continued modest appreciation.
Active listings may tick up slightly in April as sellers respond to spring demand, but the structural inventory deficit is unlikely to resolve within a single quarter. Expect active listings to remain below 1,400 through June.
Local economic factors are supportive. Sandia National Laboratories continues to expand its workforce under ongoing Department of Energy contracts, with an estimated 1,200-plus employees added to the metro over the past 18 months. Kirtland AFB's permanent party population remains stable, providing a consistent baseline of relocation demand. The New Mexico film industry, anchored by Netflix's ongoing commitment to Albuquerque Studios and the state's 25% to 35% production tax credit, continues to generate high-income transplant demand in the Nob Hill and Downtown corridors. Intel's Rio Rancho facility, while not at its 1990s employment peak, remains the West Side's largest private employer and a stabilizing force for that submarket's demand floor.
Interest rates, currently hovering in the 6.4% to 6.7% range for a 30-year conventional mortgage, remain the primary wild card. A move below 6.25% would likely release a meaningful wave of pent-up demand from buyers who have been waiting on the sidelines — and would further compress inventory and days on market. A move above 7% would cool activity at the margins, primarily in the $400,000-plus tier, but is unlikely to reverse the fundamental supply deficit that is driving prices in the core $280,000-to-$400,000 range.
Key Takeaways: Albuquerque Housing Market April 2026
- •Median price reached $342,000 in March 2026, a 3.8% year-over-year gain and the sixth consecutive monthly increase, driven by structural supply constraints rather than speculative demand.
- •Active inventory of 1,240 homes represents just 1.8 months of supply — less than half the 4-month threshold economists define as a balanced market — with Rio Rancho and the Northeast Heights showing the tightest conditions at 16 and 14 days on market respectively.
- •The $300,000-to-$400,000 price tier is the most competitive segment in the metro, with price per square foot rising to $185-$205 and homes routinely going under contract within the first weekend of listing.
- •Buyers must enter the market fully pre-approved and offer-ready, as the 22-day average DOM leaves little room for deliberation in the core price tiers; escalation clauses and clean offers are standard tools, not aggressive ones, in this environment.
- •Rio Rancho's 4.8% year-over-year appreciation leads all major submarkets, reflecting its role as the metro's primary affordability corridor and the continued employment stability provided by Intel and the Rust Medical Center campus on the West Side.
Want more insider intel?
Subscribe to get market updates and new articles delivered to your inbox.