
Albuquerque Housing Market Report: June 2026 — Cash Buyer Share Climbs as Conventional Loan Volume Softens Across the Metro
Albuquerque Housing Market June 2026: The Cash Advantage Reshapes Competition
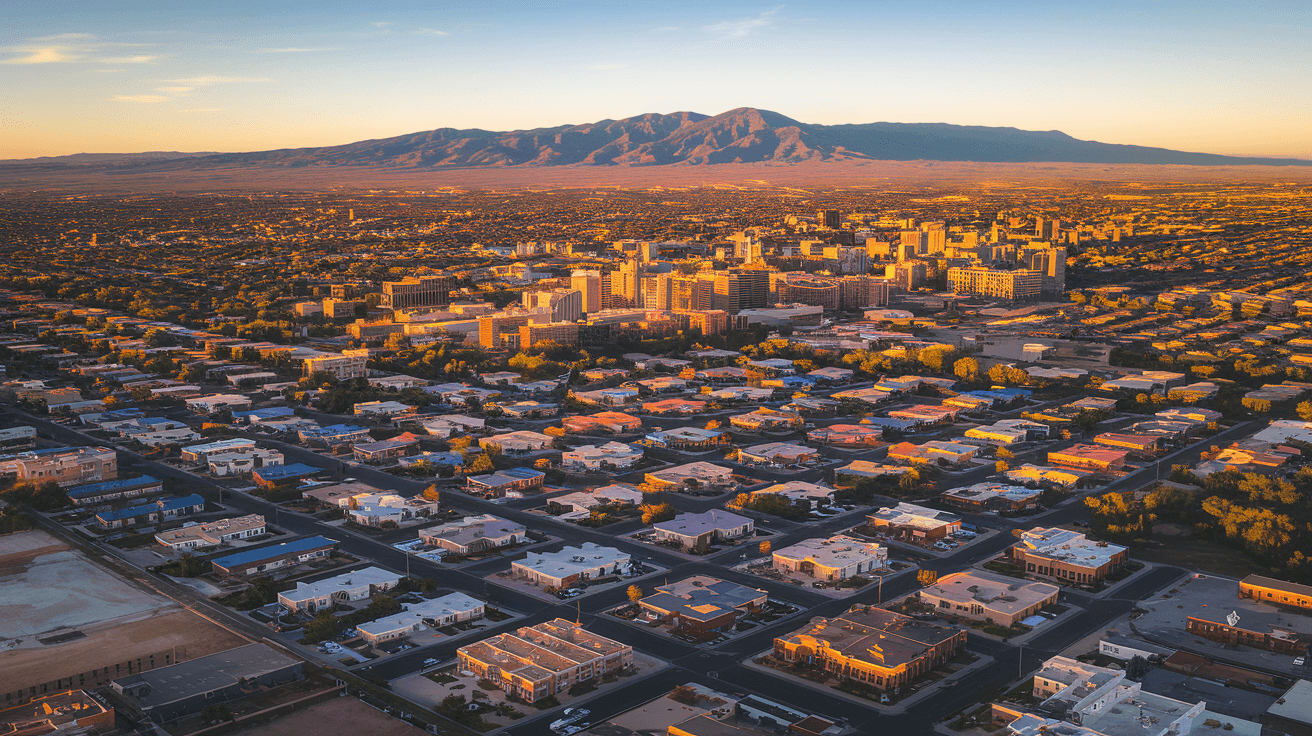
The headline number for June 2026 is $385,000 — the metro-wide median sale price for Albuquerque residential real estate. That figure represents a 3.5% year-over-year increase, a pace that is neither the frenzied appreciation of 2021 nor the stagnation that some national commentators projected for Sun Belt metros entering the back half of this decade. What makes this month's data genuinely interesting is not the price itself but the mechanism behind it: cash buyers are quietly absorbing a larger slice of the market at precisely the moment conventional loan volume is pulling back.
Across the metro, cash transactions accounted for an estimated 28% of closed sales in June, up from roughly 21% in the same month last year. That shift is not happening in a vacuum. The 30-year fixed mortgage rate has been hovering in the 7.1% to 7.4% range through most of the second quarter, a level that has meaningfully compressed purchasing power for borrowers dependent on conventional financing. The buyers still moving are either bringing equity from a prior sale, deploying investment capital, or accessing VA and FHA products — the latter two programs continuing to punch above their weight in a market with deep ties to Kirtland Air Force Base and the broader military and federal contractor workforce.
The net result is a market that feels simultaneously active and selective. Sellers in the right price tier with well-prepared homes are still fielding competitive offers. Buyers financing at current rates are doing the math carefully before writing anything.
Albuquerque Housing Inventory: Supply Is Rising But Not Flooding
Active Listings and Months of Supply
Albuquerque ended June with 3,850 active residential listings across the metro, a figure that includes single-family homes, townhomes, and condominiums within the MLS service area. That represents a roughly 14% increase from June 2025, when active inventory sat closer to 3,375 units. On a month-over-month basis, listings ticked up approximately 4% from May's count of 3,700.
The resulting months of supply is 3.9 — technically still below the 4.0 to 6.0 range that most economists define as a balanced market, but meaningfully higher than the sub-2.0 readings that characterized 2021 and 2022. The direction of travel matters here. Albuquerque has now seen four consecutive months of modest inventory growth, a trend that gives buyers more options without fundamentally transferring negotiating leverage.
New listings entering the market in June totaled approximately 1,420, while closed sales came in at 985. That gap between new supply and absorption is how inventory grows gradually rather than dramatically. Sellers are not rushing for the exits — pricing discipline remains intact — but the days of a listing attracting 14 offers by Sunday afternoon are largely behind us in all but the most desirable pockets of the city.
Where Inventory Is Building
The inventory growth is not evenly distributed. The $400,000 to $550,000 range has seen the most pronounced accumulation, particularly in newer construction corridors along the Paseo del Norte extension and in the southern reaches of Rio Rancho near the NM 528 interchange. Builders who broke ground in 2024 are delivering product into a rate environment that has cooled the pool of eligible conventional borrowers, and some of those homes are sitting longer than pro formas anticipated.
Below $325,000, inventory remains genuinely tight. Entry-level supply in established neighborhoods — think the streets off Montgomery Boulevard in the Northeast Heights, or the older ranch-style blocks near Menaul and Wyoming — continues to move quickly when priced correctly.
Albuquerque Home Prices: Tier-by-Tier Breakdown
Price Tier Analysis for June 2026
Understanding the Albuquerque market in June requires looking past the single median figure and examining how each price tier is performing.
$200,000 to $300,000: This segment is the most competitive in the metro, full stop. Inventory here is measured in weeks, not months. Homes in this range in the International District, parts of the South Valley, and older sections of the West Side near Coors and Montano are attracting multiple offers and frequently closing above list price. The average list-to-sale ratio for this tier is approximately 101.3%, meaning buyers are paying over asking as a matter of course. First-time buyers and VA borrowers dominate this segment.
$300,000 to $400,000: This is the market's engine — the highest transaction volume tier. The metro median of $385,000 sits squarely here. Competition is real but rational. Well-located homes in the Northeast Heights, Taylor Ranch, and the older Rio Rancho neighborhoods within walking distance of Rust Medical Center are moving in under three weeks. Homes that need work or carry deferred maintenance are sitting longer as buyers at this price point have enough options to be selective.
$400,000 to $500,000: A transitional zone. Demand is present but financing friction is most visible here. A buyer stretching to $475,000 with a conventional loan at 7.2% is carrying a principal and interest payment north of $2,900 per month before taxes and insurance. That math is pushing some buyers to pause. Average days on market in this tier: approximately 38 days, and price reductions are becoming more common.
$500,000 and above: The luxury and semi-luxury segment is where the cash buyer story is most pronounced. In High Desert, Corrales, and the foothills neighborhoods above the Tramway corridor, cash transactions are closing deals that would otherwise stall in underwriting. Median days on market above $500,000 is 52 days, and sellers in this range should be prepared for genuine negotiation. Year-over-year price appreciation in this tier is running closer to 1.5% to 2.0%, well below the metro average.
“"The Albuquerque market in June 2026 is best understood as two markets operating simultaneously: a supply-constrained entry and mid-tier segment where buyers compete, and a softening upper tier where cash is king and patience is rewarded."
Days on Market: What the Velocity Data Tells Buyers and Sellers
The metro-wide average days on market of 34 masks significant variation that buyers need to understand before structuring offers. That 34-day figure is a blended average pulled toward the high end by the slower upper-price-tier properties described above.
For homes priced between $275,000 and $375,000 in well-located neighborhoods, the realistic expectation is 18 to 24 days from list to contract. That is not a frenzied market, but it is not a leisurely one either. Buyers who need two weekends to think about a home in Nob Hill or the North Valley are routinely losing to buyers who moved on the first showing.
The deceleration from the pace of mid-2024 — when comparable homes were going under contract in 10 to 14 days — is real, and it is meaningful for offer strategy. Buyers today have slightly more room to conduct due diligence, request inspection periods, and negotiate minor repairs. The era of waiving every contingency to be competitive has passed in most of the market. That said, waiving appraisal contingencies remains common in the sub-$350,000 segment, particularly when cash offers are in the mix.
For sellers, the 34-day average carries a warning embedded in it: overpricing by even 3% to 5% in the current environment will not be corrected by a bidding war. It will result in a price reduction and a longer cumulative days-on-market figure that signals weakness to subsequent buyers.
Albuquerque Neighborhood-by-Neighborhood Market Data
Northeast Heights
Median Sale Price: $348,000 | Average DOM: 22 days | YoY Price Change: +4.8%
The Northeast Heights remains the metro's most transactionally active submarket. The combination of established schools, proximity to Uptown and Presbyterian Rust Medical facilities along the Eubank and Louisiana corridors, and relative affordability continues to drive demand from both local move-up buyers and relocating federal employees tied to Kirtland and Sandia National Laboratories. Homes on the streets east of Eubank between Candelaria and Montgomery are seeing the sharpest competition. The 4.8% year-over-year appreciation here outpaces the metro average.
Nob Hill
Median Sale Price: $415,000 | Average DOM: 28 days | YoY Price Change: +3.2%
Nob Hill's walkability along Central Avenue — from the KiMo Theatre district east through the restaurant and boutique corridor near Girard — continues to attract buyers who prioritize urban lifestyle over square footage. The neighborhood's older Craftsman and Spanish Colonial Revival stock is a finite supply, which provides a price floor. Inventory here is genuinely limited, and when a well-restored home comes to market near Monte Vista or Tulane, it moves. The 28-day average DOM reflects the more deliberate buyer profile this neighborhood attracts.
North Valley
Median Sale Price: $448,000 | Average DOM: 31 days | YoY Price Change: +2.9%
The North Valley's character — horse properties, mature cottonwoods along the Rio Grande bosque, and the agricultural easements that keep the land open — commands a premium that interest rate cycles do not fully erode. Buyers here are frequently equity-rich and less rate-sensitive. The Corrales Road and Rio Grande Boulevard corridors are seeing steady activity. The 2.9% appreciation rate trails the metro, reflecting the upper-tier softness noted elsewhere, but values here are remarkably stable.
Rio Rancho
Median Sale Price: $318,000 | Average DOM: 19 days | YoY Price Change: +5.1%
Rio Rancho is the metro's growth engine and the data confirms it. The 5.1% year-over-year appreciation is the strongest of any major submarket covered in this report. Intel's ongoing Ocotillo-to-Rio Rancho supply chain investments and the continued expansion of the Presbyterian Rust Medical Center campus are supporting employment that feeds directly into housing demand. New construction in the Lomas Encantadas and Cabezon subdivisions is moving as fast as builders can deliver. Entry-level buyers priced out of Albuquerque proper are finding Rio Rancho to be the practical alternative.
Corrales
Median Sale Price: $612,000 | Average DOM: 48 days | YoY Price Change: +1.7%
Corrales is a market unto itself. The village's strict land use policies, the pastoral character of Corrales Road, and the proximity to both the bosque and the Sandia foothills create demand that is largely insulated from rate movements — but that insulation is not absolute. At $612,000 median, the cash buyer dynamic is in full effect. Sellers here should expect longer marketing periods and be prepared to negotiate on price and terms. The 1.7% appreciation is modest but reflects a market where values have already reached a level that limits further rapid gains.
High Desert
Median Sale Price: $658,000 | Average DOM: 54 days | YoY Price Change: +1.4%
High Desert, the master-planned community in the foothills east of the Tramway, is experiencing the clearest version of the upper-tier softness playing out across the metro. The neighborhood's desert contemporary architecture, trail access, and Sandia Mountain views remain compelling, but the buyer pool at this price point is narrow and increasingly rate-conscious. Homes that are priced at or slightly below recent comparable sales are moving; homes testing the ceiling are sitting. The 54-day average DOM is the highest of any submarket in this report.
Downtown Albuquerque / EDo (East Downtown)
Median Sale Price: $295,000 | Average DOM: 36 days | YoY Price Change: +3.8%
The Downtown and EDo corridor — anchored by the Railyards development, the Rail Runner station, and the emerging restaurant and arts scene along Gold and Silver Avenues — continues its slow but genuine revitalization. Condo and townhome product dominates here, and the buyer profile skews toward young professionals, empty nesters downsizing from larger homes, and film industry workers on longer-term New Mexico projects. The New Mexico Film Office's continued incentive program is a real demand driver in this submarket that local analysts sometimes undercount.
Taylor Ranch
Median Sale Price: $362,000 | Average DOM: 24 days | YoY Price Change: +4.1%
Taylor Ranch on Albuquerque's West Side continues to outperform its reputation as a purely functional suburb. The neighborhood's access to the Paseo del Norte corridor, the proximity to Cottonwood Mall and the medical facilities along Coors, and its relatively newer housing stock make it a consistent performer. The 4.1% year-over-year appreciation and 24-day average DOM reflect a submarket that is absorbing demand efficiently.
What This Market Means for Buyers and Sellers in June 2026
Advice for Albuquerque Home Buyers
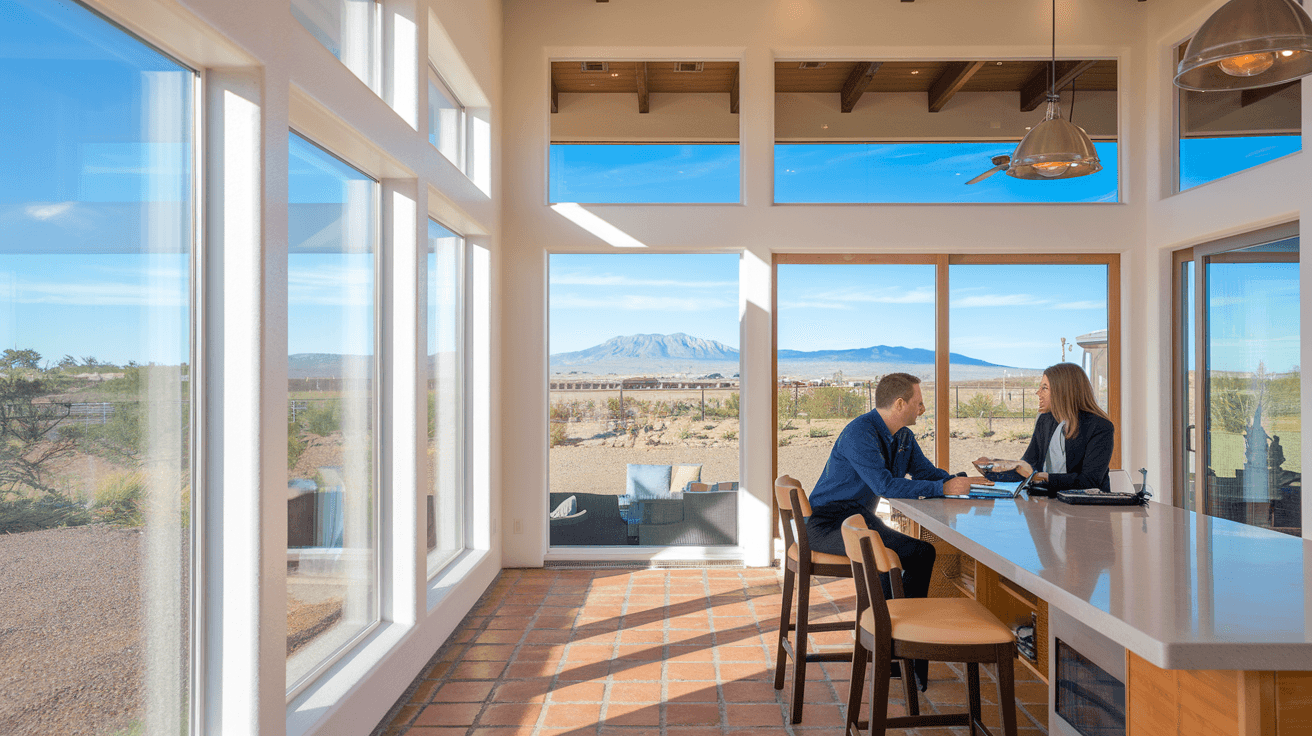
If you are buying in June 2026, the single most important thing you can do before writing an offer is get fully underwritten — not just pre-approved. With cash buyers competing in virtually every price tier, a fully underwritten commitment letter from your lender is the closest a financed buyer can get to the certainty that cash conveys. Sellers know the difference.
Below $375,000, move with urgency. The inventory data does not support a wait-and-see approach in this tier. If a home in the Northeast Heights or Taylor Ranch meets your criteria, the probability that it will still be available in 10 days at the same price is not high. Above $450,000, you have more room to breathe, conduct thorough inspections, and negotiate. Use that leverage.
For buyers considering Rio Rancho specifically: the appreciation trajectory there is the strongest in the metro, and the employment base supporting it is institutional. Intel and Presbyterian Rust are not going anywhere. Buyers who have been hesitant about Rio Rancho due to its perception as a commuter suburb should revisit that assumption — the submarket has matured.
On rate strategy: if you are buying with a conventional loan at current rates, model your payment at today's rate and stress-test your budget there. Refinancing into a lower rate environment is a reasonable long-term expectation, but do not buy a home whose payment only works at a hypothetical future rate.
Advice for Albuquerque Home Sellers
Pricing discipline is the single variable most within a seller's control in June 2026, and it is the variable that most sellers underestimate. The list-to-sale ratio of 97.8% tells you that buyers are not paying dramatically over ask in most of the market — but they are paying close to ask when the home is priced correctly from day one. A home that enters the market at $425,000 when comparable sales support $405,000 will not close at $425,000. It will close at $395,000 after a price reduction, an extended market time, and a buyer pool that has been trained to negotiate by the home's history.
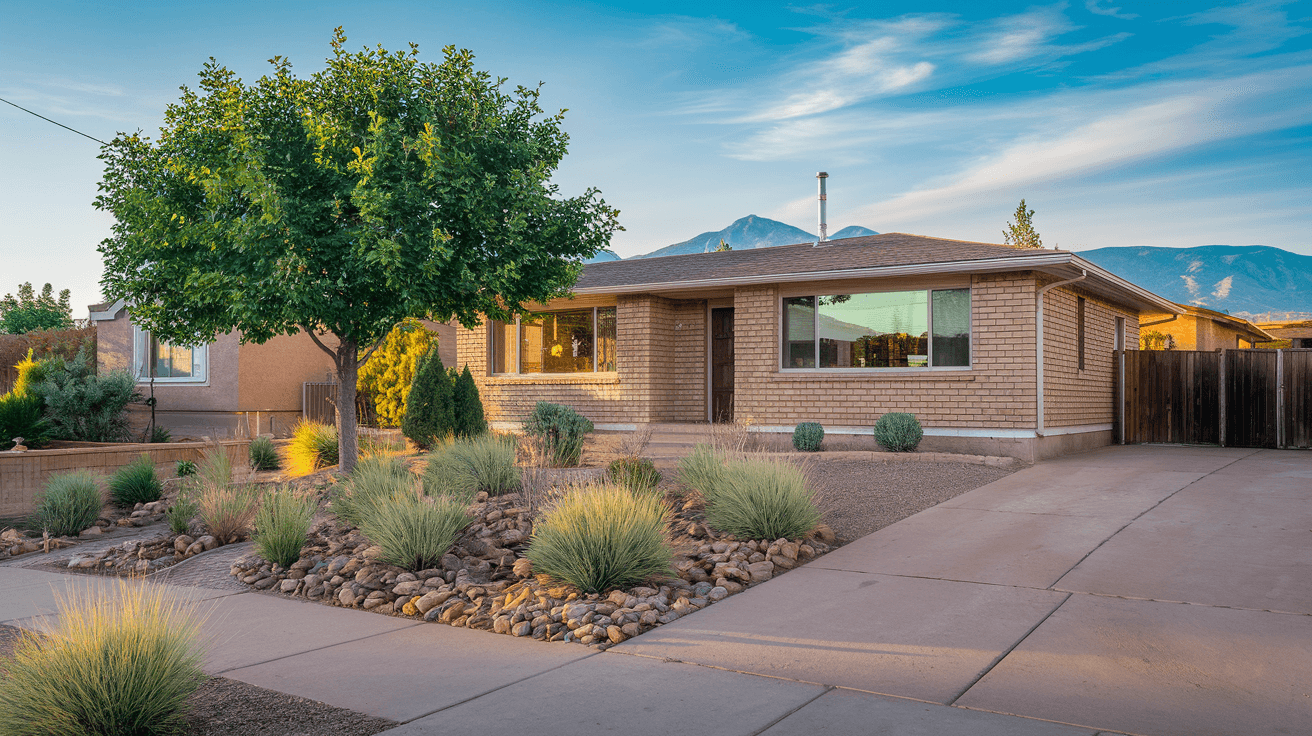
Presentation matters more than it did two years ago. With 34 days of average market time, buyers are making comparisons across multiple homes. Professional photography, a clean and decluttered interior, and attention to curb appeal — especially xeriscaping that signals low maintenance to buyers unfamiliar with desert landscaping — are not optional in this environment.
If you are selling in the $500,000-plus range, be prepared to consider concessions. Seller-paid rate buydowns are increasingly common in this tier and can be more effective than a straight price reduction in attracting financed buyers.
“"In a market where cash represents 28% of closings, financed sellers competing for the same buyer pool need every presentation and pricing advantage available. The gap between a well-prepared listing and an average one has widened considerably since 2024."
Albuquerque Real Estate Outlook: What to Expect in July and August 2026
Seasonal patterns in Albuquerque are meaningful. July and August bring the monsoon season, which historically correlates with a modest slowdown in showing activity during afternoon hours but does not materially reduce transaction volume. The metro typically sees a slight uptick in new listings in July as families who waited for school to end bring homes to market, followed by a drawdown in August as the summer selling season winds toward the fall.
The interest rate environment is the dominant variable heading into Q3. If the Federal Reserve signals any dovish pivot at the July FOMC meeting, expect a near-term surge in buyer activity from the sidelines — there is meaningful pent-up demand from households who have been qualifying-but-waiting. A rate move of even 25 to 50 basis points in the right direction would meaningfully expand the eligible buyer pool at the $350,000 to $450,000 price point.
On the employment side, Sandia National Laboratories' continued expansion under its NNSA contract — which runs through 2029 — is a steady source of high-income household formation in the Northeast Heights and High Desert submarkets. The New Mexico film industry, buoyed by ongoing studio expansion in the South Valley and a full production calendar at Albuquerque Studios, continues to generate demand for short- and medium-term rentals as well as purchases from crew members making permanent moves. UNM's fall enrollment cycle will begin driving rental demand in the Nob Hill and University adjacent neighborhoods by late July.
The most likely scenario for July 2026 is modest inventory growth, stable prices, and continued bifurcation between the competitive entry and mid-tier segments and the more negotiable upper tier. A significant rate move in either direction would be the primary catalyst for deviation from that base case.
Key Takeaways: Albuquerque Housing Market June 2026
- •Cash buyers now represent approximately 28% of closed transactions in the Albuquerque metro, up from 21% in June 2025, reshaping competitive dynamics across all price tiers and giving sellers a new variable to weigh when evaluating offers.
- •The metro median price of $385,000 represents 3.5% year-over-year appreciation, a sustainable pace that reflects genuine demand rather than speculative pressure — Rio Rancho leads all major submarkets at 5.1% YoY growth.
- •Inventory at 3.9 months of supply is rising gradually — up 14% from a year ago — but remains below the 4.0-to-6.0 balanced market threshold, meaning sellers retain a modest structural advantage in most price tiers below $450,000.
- •The sub-$325,000 segment is functionally a seller's market with list-to-sale ratios above 101% and average days on market under 22 days; buyers in this range should arrive fully underwritten and prepared to move within 48 to 72 hours of a listing going active.
- •Upper-tier homes above $500,000 are averaging 52-plus days on market with appreciation running at roughly half the metro rate, creating genuine negotiating opportunities for buyers with the financial flexibility to operate in that range — particularly in High Desert and Corrales.
Want more insider intel?
Subscribe to get market updates and new articles delivered to your inbox.