Albuquerque Housing Market Report: July 2026 — Price Reduction Frequency by ZIP Code as Sellers Recalibrate Expectations and the Gap Between List Price and Close Price Widens Across the Metro
Albuquerque Housing Market Report: July 2026 — Price Reduction Frequency by ZIP Code as Sellers Recalibrate Expectations and the Gap Between List Price and Close Price Widens Across the Metro
The Albuquerque housing market in July 2026 is telling two stories at once, and reading only one of them will cost you money.
On the surface, the metro median home price sits at $385,000, a 3.5% gain year-over-year and a number that looks reassuring on a dashboard. But underneath that headline, a meaningful structural shift is underway. Sellers who priced aggressively heading into the summer — banking on the momentum that carried this market through late 2024 and most of 2025 — are now cutting prices at a rate not seen since early 2023. Price reductions are appearing in ZIP codes that haven't seen them in volume for over two years. The list-to-sale ratio has narrowed to 97.8%, down from 99.1% in March, and average days on market have extended to 34 days, up from 26 days in April.
This is not a market in distress. It is a market in correction — specifically, a correction of seller expectations. And for buyers who have been waiting on the sidelines, that distinction matters enormously.
Albuquerque Housing Market Overview: July 2026 Metro Conditions
The July data shows 3,850 active listings across the metro, representing 3.9 months of inventory — the highest level since October 2022. That number is still technically a seller's market (six months is considered balanced), but the trajectory is what commands attention. Inventory has grown 22% since January 2026, driven by a combination of new listings entering the market and homes simply taking longer to sell.
New listings in July came in at approximately 1,340, while closed sales registered around 980 — a gap that has widened each month since April. When new listings consistently outpace closings, active inventory climbs, competition among sellers intensifies, and buyers gain leverage they haven't had in years.
What is driving this inventory build? Several converging forces. Mortgage rates in the 6.75% to 7.1% range have kept a meaningful segment of move-up buyers locked in place, unwilling to trade a 3% rate for a 7% one. First-time buyers, who represent the foundation of demand in the $280,000 to $360,000 price range, are stretching affordability limits in a market where that entry point now barely gets you into the Northeast Heights. And sellers who watched neighbors close above asking price in 2024 are still pricing to that memory rather than to current market conditions.
The result is a growing pile of listings with price reduction flags — and ZIP codes that tell very different stories.
Albuquerque Housing Supply and Demand Dynamics: Inventory Tightening or Loosening?
The supply picture in July 2026 is unambiguously loosening, but not uniformly. The 3.9 months of inventory metro-wide masks significant variation by price tier and geography.
In the $200,000 to $300,000 range, inventory remains razor thin at roughly 1.4 months. There are simply not enough homes in this bracket to satisfy demand from first-time buyers, investors, and downsizers. When a turnkey three-bedroom in the South Valley or a renovated mid-century ranch near Wyoming and Menaul hits this price range, it typically draws multiple offers within the first weekend.
The $300,000 to $400,000 tier is where the market is most actively recalibrating. Inventory here has climbed to 3.2 months, and price reductions are most frequent. This is the sweet spot where sellers are competing hardest and buyers have the most room to negotiate. ZIP codes 87111 (the upper Northeast Heights corridor near Tramway) and 87122 (High Desert and Tanoan area) have seen price reduction rates climb above 28% of active listings — meaning more than one in four sellers in those ZIPs has already cut their asking price at least once this summer.
The $400,000 to $500,000 segment sits at approximately 4.6 months of inventory, and the $500,000-plus luxury tier is carrying a substantial 6.8 months — effectively a buyer's market at the upper end. Homes in Corrales, the North Valley horse properties, and custom builds in High Desert that launched at ambitious spring prices are now sitting, accumulating days on market, and testing seller resolve.
Compared to July 2025, overall active listings are up 31%. That is a significant year-over-year shift, and it has real implications for pricing strategy on both sides of a transaction.
Albuquerque Home Price Analysis by Tier: Where Competition Remains Hot
The metro median of $385,000 reflects a market that has appreciated meaningfully over the past three years but is now finding its ceiling at current mortgage rates. The average sale price sits at $421,000, pulled upward by luxury transactions in the North Valley and Corrales. Price per square foot metro-wide averages $198, down from a peak of $211 in August 2025.
Price Tier Breakdown
$200,000 to $300,000: This tier is the most competitive in the metro. Homes here are selling in an average of 16 days, and the list-to-sale ratio holds at 100.3% — meaning buyers are still paying above asking price on average. The volume of homes available here is insufficient to meet demand, and that fundamental imbalance is unlikely to resolve without a significant wave of new construction at affordable price points, which the current cost of land and materials makes nearly impossible to deliver profitably.
$300,000 to $400,000: Average days on market have stretched to 31 days, and the list-to-sale ratio has dropped to 98.1%. Buyers in this range are successfully negotiating closing cost contributions, inspection repairs, and in some cases modest price reductions. The homes that are selling quickly in this tier share a profile: updated kitchens, newer HVAC systems, and curb appeal that photographs well.
$400,000 to $500,000: At 38 days on market and a 97.2% list-to-sale ratio, this tier is where sellers are feeling the most pressure. Many of these homes are competing against new construction in Rio Rancho's master-planned communities, where builders are offering rate buydowns and design center credits that resale sellers cannot easily match.
$500,000 and above: With 6.8 months of inventory and an average 52 days on market, the luxury segment is operating in a fundamentally different market. The list-to-sale ratio here has fallen to 95.6%, meaning the gap between what sellers ask and what buyers pay has widened to roughly $25,000 to $40,000 on a typical transaction. Sellers in this tier who are not willing to price to current market conditions are finding themselves invisible.
“"The homes selling fastest in Albuquerque right now are not the most expensive or the most renovated — they are the ones priced to the market that exists in July 2026, not the market sellers remember from 2024."
Albuquerque Days on Market: What the Pace Tells Buyers About Offer Strategy
At 34 days on market metro-wide, Albuquerque is no longer a market where buyers need to write offers from the parking lot. The urgency that defined 2021 through mid-2024 — waived inspections, gap clauses, escalation addenda reaching 15% above list — has largely dissipated except in the entry-level tier.
For buyers, this shift has practical implications. A home that has been on market for more than 21 days in the current environment is a candidate for meaningful negotiation. At 30 days, sellers who are motivated are typically receptive to price adjustments, closing cost assistance, or flexible possession dates. At 45-plus days, the conversation changes entirely — these sellers are often facing carrying costs, life circumstances, or competing listings that make them genuinely flexible.
The distribution of days on market is also telling. Approximately 38% of homes are selling within the first 10 days, while 29% are sitting beyond 45 days. That bimodal distribution reflects a market where correctly priced, well-presented homes still move quickly, but overpriced inventory accumulates and drags the average upward. The 34-day average is not a uniform experience — it is the average of two very different markets operating simultaneously.
Albuquerque Neighborhood-by-Neighborhood Breakdown: July 2026
Northeast Heights (87111, 87112)
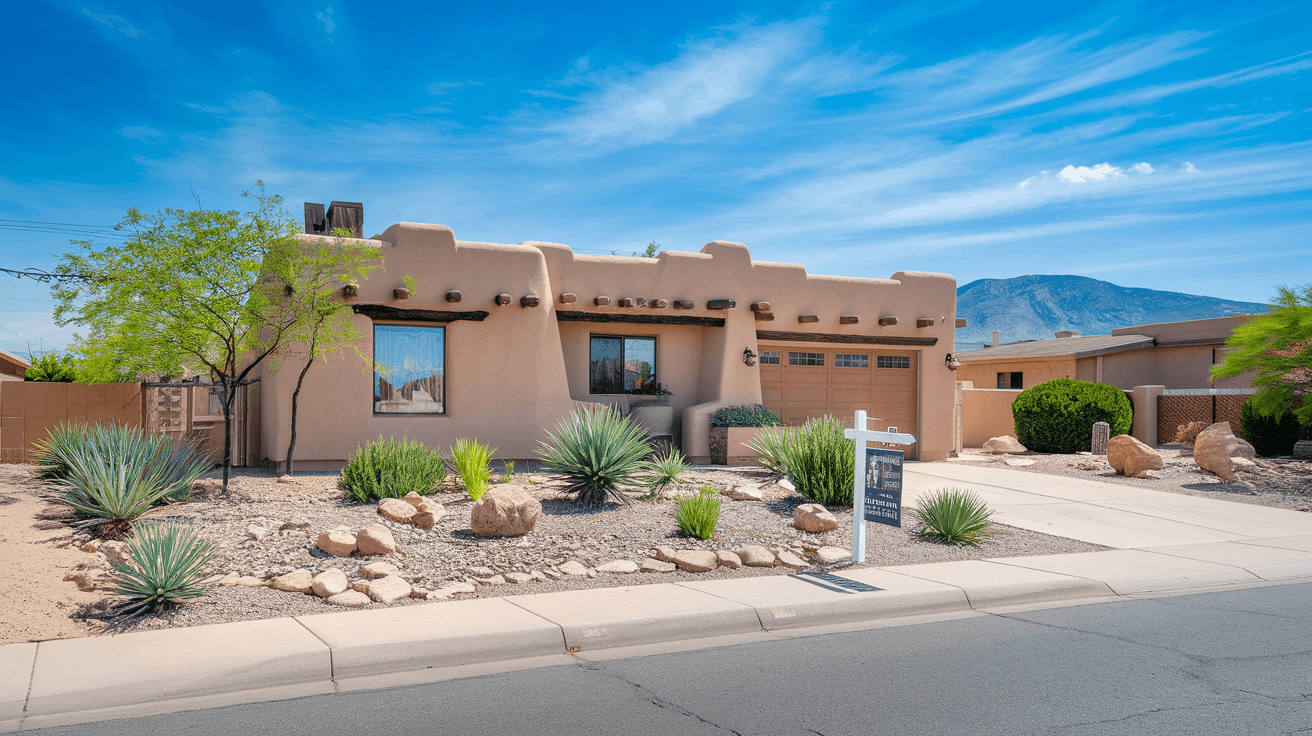
The Heights corridor from Eubank to Tramway remains one of the metro's most liquid submarkets. Median price: $348,000. Average days on market: 22 days. Year-over-year price change: +4.1%. The neighborhoods east of Wyoming Boulevard — particularly the established blocks near Eldorado High School and the Sandia Foothills Open Space trailheads — continue to attract buyers who want proximity to the mountains without the premium of High Desert. Price reductions here are appearing, but primarily on homes priced above $400,000. Below that threshold, well-maintained ranches and split-levels are still moving with competitive offers.
Nob Hill (87106, 87108)
The Central Avenue corridor and surrounding Nob Hill blocks have become one of the more interesting stories in the July data. Median price: $392,000. Average days on market: 29 days. Year-over-year price change: +2.8%. The neighborhood's walkability to Nob Hill's restaurant row, the KiMo Theatre district, and Expo New Mexico has attracted younger buyers and investors, but the aging housing stock — much of it 1940s and 1950s construction — is creating inspection hurdles that are slowing closings. Sellers here need to price in deferred maintenance realistically; buyers who can see past cosmetic issues are finding genuine value.
North Valley (87107, 87114)
The North Valley's irrigated lots, mature cottonwoods along the Bosque, and proximity to Old Town continue to command a premium that is holding firm. Median price: $428,000. Average days on market: 26 days. Year-over-year price change: +3.2%. Horse properties and larger parcels along Corrales Road and Rio Grande Boulevard are taking longer to sell (averaging 41 days for lots over half an acre), but the core neighborhood market for three- and four-bedroom homes remains active. The North Valley's supply is structurally constrained by the acequia system and limited developable land, which provides a floor under prices that other neighborhoods lack.
Rio Rancho (87124, 87144)
Rio Rancho continues to be the metro's value proposition, and July's data confirms that the city is absorbing significant demand from buyers priced out of Albuquerque proper. Median price: $318,000. Average days on market: 28 days. Year-over-year price change: +5.2% — the strongest appreciation rate in the metro. The master-planned communities near Mariposa and Loma Colorado are competing effectively against resale inventory, with builders offering incentives that are difficult for individual sellers to match. Intel's continued operations at the Rio Rancho campus and the steady employment base it provides remain a fundamental demand driver for this submarket.
Corrales
Corrales is operating in a different universe from the rest of the metro. Median price: $587,000. Average days on market: 48 days. Year-over-year price change: +1.4%. The village's strict zoning, agricultural character, and proximity to both Albuquerque and Rio Rancho make it perennially desirable, but at current price levels and mortgage rates, the buyer pool is narrow. Homes here are sitting longer, and sellers who launched at ambitious spring prices are the ones driving the local price reduction statistics. Corrales is a market where patience is required — in both directions.
High Desert
High Desert, the upscale planned community tucked against the Sandia foothills east of Tramway, is experiencing its most pronounced softening in four years. Median price: $648,000. Average days on market: 54 days. Year-over-year price change: +0.9%. The combination of high price points, elevated mortgage rates, and a wave of new listings from sellers who bought at the peak has created genuine buyer leverage here. The community's HOA amenities, trail access, and views remain compelling, but buyers are negotiating successfully — often landing 3% to 5% below original list price after one or two reductions.
Downtown / EDo (87102)
The Downtown and East Downtown (EDo) corridor is the metro's most polarized submarket. Median price: $295,000. Average days on market: 37 days. Year-over-year price change: +2.1%. Loft conversions and newer infill construction near the Albuquerque Rail Yards development are attracting remote workers and creative professionals, while older inventory on the edges of the neighborhood is struggling. The ongoing Rail Yards activation project and proximity to the Albuquerque Sunport remain long-term demand catalysts, but the submarket requires patient, informed buyers who understand what they are buying.
Taylor Ranch (87120)
Taylor Ranch on the West Side continues to deliver consistent, unspectacular performance — which is exactly what many buyers are looking for. Median price: $342,000. Average days on market: 24 days. Year-over-year price change: +3.8%. The neighborhood's established schools, access to Paseo del Norte, and relatively newer housing stock (predominantly 1990s and 2000s construction) make it a reliable choice for families. Inventory here is lean enough that well-priced listings are still generating multiple offers, though the frenzy of 2023 and 2024 is gone.
What July 2026 Means for Albuquerque Buyers and Sellers

If You Are Buying
July 2026 is the most favorable environment for Albuquerque buyers since early 2023, with important caveats. The advantage is real but uneven. At price points below $300,000, you are still competing, still potentially writing above asking price, and still facing the pressure of limited inventory. At $350,000 and above, the market is working in your favor in ways that were unthinkable eighteen months ago.
Specific strategies that are working right now: First, target homes that have been on market 21 days or longer — these sellers have already watched the initial interest period pass and are psychologically ready to negotiate. Second, request inspection repair credits rather than price reductions where possible; in many cases sellers will agree to credits that effectively reduce your out-of-pocket costs without triggering a formal price reduction that shows up on the listing history. Third, ask for a closing cost contribution — in the $400,000 to $500,000 range, contributions of $8,000 to $12,000 are increasingly common and can meaningfully reduce your cash to close.
Mortgage rate strategy matters in this environment. A rate buydown funded by seller concessions can be more valuable than a price reduction, particularly if you anticipate refinancing within three to five years as rates normalize.
If You Are Selling
The sellers succeeding in July 2026 share one characteristic: they priced to the current market on day one. The data is unambiguous on this point. Homes that launch within 2% of their eventual sale price are selling in an average of 19 days. Homes that launch above market and require one or more reductions are averaging 51 days — and selling for less than they would have if priced correctly from the start.
Presentation and condition matter more than they have in years. When buyers have options and time, they choose the home that feels move-in ready. Deferred maintenance items that buyers overlooked in 2022 because they were desperate to win a home are now becoming deal-killers or negotiating points. A $4,000 HVAC service, fresh interior paint, and professional photography are not optional line items — they are the cost of competing effectively in a market with 3,850 active listings.
“"In a market where 28% of active listings in some ZIP codes have already taken at least one price reduction, the sellers winning are the ones who priced it right the first time."
If your home has been on market more than three weeks without an offer, the price is the problem. The Albuquerque market in July 2026 is providing feedback in real time — and that feedback is worth listening to.
Albuquerque Real Estate Outlook: What to Expect in August 2026
Several forces will shape the Albuquerque market over the next 30 to 60 days.
Seasonally, August typically brings a modest slowdown in new listing activity as families with school-aged children complete their moves before the Albuquerque Public Schools calendar begins. This seasonal pullback in new supply could provide temporary relief for sellers who have been competing against a crowded field. However, demand typically softens in parallel as families settle in, so the net effect on days on market is often neutral.
The interest rate environment remains the single largest variable. The Federal Reserve's posture heading into fall 2026 will determine whether the 6.75% to 7.1% rate range that has constrained move-up buyer activity begins to ease. A meaningful rate reduction — even 50 basis points — would unlock a significant cohort of homeowners currently frozen by their existing low-rate mortgages, both as sellers entering the market and as buyers gaining purchasing power.
On the demand side, Kirtland Air Force Base and Sandia National Laboratories continue to generate steady relocation demand that provides a baseline of activity regardless of broader market conditions. The Albuquerque film industry, which has brought significant economic activity and high-income transplants to the metro over the past several years, remains an active demand driver particularly in the Nob Hill, Downtown, and North Valley submarkets. UNM's fall enrollment cycle will generate rental and purchase activity in the university corridor through September.
Intel's Rio Rancho operations, while not expanding at the pace of earlier in the decade, continue to anchor employment on the West Side and support demand in the $300,000 to $400,000 range that is the backbone of Rio Rancho's market.
The most likely August scenario: inventory levels hold near current levels or tick slightly lower as new listing activity seasonally declines. Days on market remain elevated relative to spring. Price reduction activity continues in the $400,000-plus segment. The entry-level market below $300,000 remains competitive with limited inventory. Overall, the balance of power continues its gradual shift toward buyers at higher price points, while sellers in the entry-level tier retain leverage.
Key Takeaways: Albuquerque Housing Market July 2026
- •Seller recalibration is real and measurable: Price reduction frequency has climbed above 28% of active listings in ZIP codes 87111 and 87122, reflecting a market where ambitious spring pricing has collided with buyer resistance at current mortgage rates.
- •The 97.8% list-to-sale ratio is the lowest since Q1 2023: Buyers are successfully negotiating below asking price across the $350,000-plus market, with the luxury segment ($500,000+) seeing an average gap of $25,000 to $40,000 between original list price and final sale price.
- •Rio Rancho is the metro's appreciation leader at +5.2% YoY: Driven by Intel employment stability, builder incentives, and value migration from Albuquerque proper, Rio Rancho's $318,000 median makes it the most accessible submarket for first-time buyers with meaningful appreciation potential.
- •Inventory at 3.9 months is the highest since October 2022: The 22% inventory increase since January 2026 has fundamentally changed offer strategy — buyers above $350,000 should be targeting homes with 21-plus days on market and negotiating closing cost contributions of $8,000 to $12,000.
- •Homes priced correctly from day one sell in 19 days; overpriced homes that require reductions average 51 days: In a market with 3,850 active listings, the cost of overpricing is not a slower sale — it is a lower final sale price, as buyer attention and negotiating leverage compound with every week a listing sits.
Want more insider intel?
Subscribe to get market updates and new articles delivered to your inbox.